
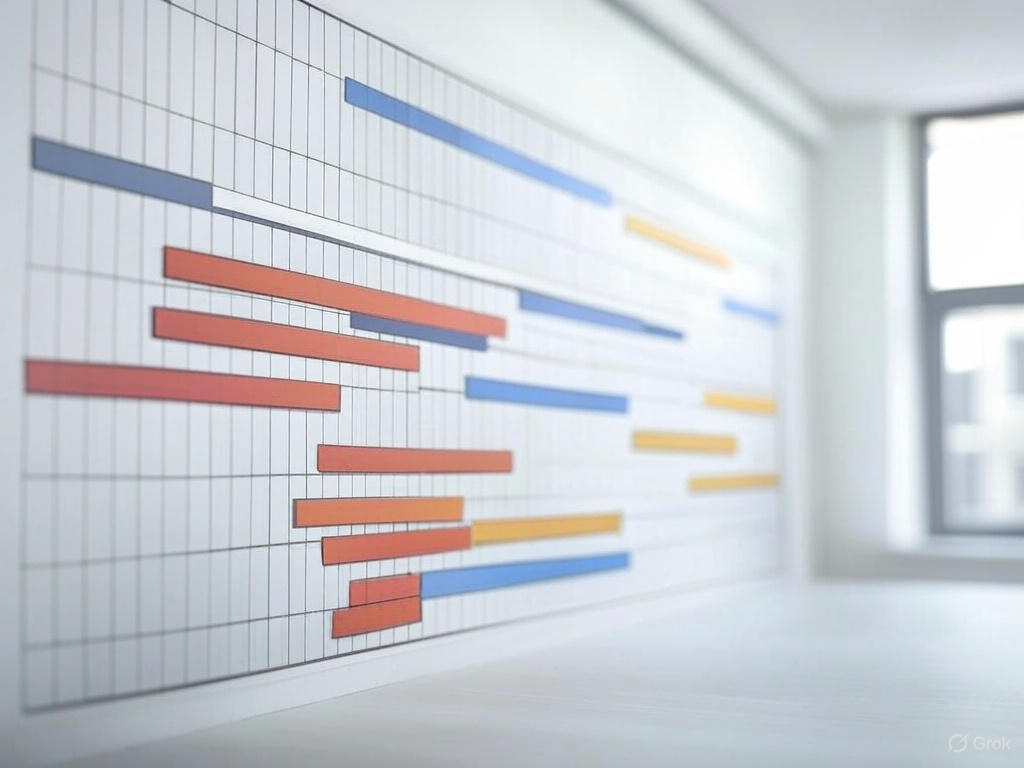
Over more than a century, the Gantt chart has become the essential tool for construction scheduling. From small residential projects to large industrial sites, it shows at a glance the sequence of tasks, their durations and their interdependencies. Yet many contractors still use it as a simple reminder, without tapping into its real power: control of the critical path and predictable delivery.
Here is how to build a Gantt chart that does more than decorate an office wall — one that becomes the real brain of your project.
What is a Gantt chart in construction?
A Gantt chart is a visual representation of your schedule in the form of horizontal bars. Each bar is a task, its length represents its duration, and its position on the timeline shows its start and finish dates. The arrows linking the bars represent the dependencies between tasks.
In construction, it typically includes:
- Major phases (excavation, foundations, structure, envelope, finishes).
- Trades (carpentry, plumbing, electrical, HVAC).
- Contract milestones (handover, inspections, approvals).
- Assigned resources (crews, equipment, subcontractors).
- External constraints (material deliveries, holidays, weather).
6 steps to build an effective Gantt chart
1. Break the project down into work packages (WBS)
Before drawing a single bar, break the project down into a Work Breakdown Structure. The finer the breakdown, the more accurate the tracking. A rule of thumb: no task should exceed 5% of the total project duration.
2. Estimate durations rigorously
The classic mistake: overestimating your crews or relying on gut feeling. Use historical productivity rates instead (m² of formwork per day, linear metres of partition per crew) drawn from your past projects. Document each project to enrich this database.
3. Identify dependencies
There are four types of links: Finish-to-Start (FS, the most common), Start-to-Start (SS), Finish-to-Finish (FF) and Start-to-Finish (SF, rare). Defining these links properly is what turns a visual Gantt chart into a tool that calculates dates automatically.
4. Assign resources
Each task must be linked to a specific resource (crew, subcontractor, equipment). Without this, it is impossible to detect overallocations when several projects run in parallel.
5. Calculate the critical path
The critical path is the sequence of tasks that determines the project finish date. Any delay on one of these tasks delays the entire delivery. Every scheduling software (MS Project, Primavera, Asta Powerproject) calculates it automatically from dependencies and durations.
6. Set a baseline
Before starting the project, save a “baseline” version of your Gantt chart. This is what will later let you compare the initial plan to actual progress and analyze variances.
How to use the Gantt chart during construction
A Gantt chart is only useful if it is updated regularly. The recommended frequency is weekly, ideally on Friday afternoon. For each task in progress, enter:
- The actual percentage complete.
- The actual start date (if it changed).
- The estimated remaining duration.
- Obstacles encountered (late deliveries, weather, labour shortages).
The software then automatically recalculates the forecast project finish date. If it deviates from the baseline, that is a warning sign that should trigger a review meeting.
Software tools for Gantt charts
- Microsoft Project: the reference for construction — critical path calculation, resource pool, multi-project management.
- Primavera P6: the standard for large industrial and infrastructure projects.
- Asta Powerproject: very popular in the UK, built for construction.
- Smartsheet, Monday, ClickUp: lighter alternatives for small projects.
- Excel: possible for simple projects, but limited as soon as multiple projects are involved.
Pitfalls to avoid
- Too much detail: a 1,000-line Gantt chart becomes unreadable. Use groupings (phases, work packages).
- Not enough float: planning 10 to 15% float on non-critical tasks avoids the domino effect.
- Forgetting milestones: inspections, municipal approvals and material deliveries should appear as distinct milestones.
- Not communicating the Gantt chart: the chart should be posted on site and sent weekly to foremen and subcontractors.
From a simple Gantt chart to multi-project management
Mastering the Gantt chart on a single project is one thing. Coordinating several simultaneous Gantt charts that share the same crews is another level of skill. That is where tools like MS Project show their real power, with the shared resource pool feature that automatically detects conflicts between projects.
Going further
The Gantt chart is even more powerful when it is part of a comprehensive project management approach. Discover:
- Multi-project management in construction with MS Project — coordinate several projects simultaneously with a structured approach.
- Shared resource pools in construction — optimize the allocation of your crews and equipment across your projects.
🎓 Take it to the next level with RBQ-recognized training
CalcosaTech offers training recognized by the Régie du bâtiment du Québec (number 5877-4407-F001) that goes well beyond the basic Gantt chart: master projects and subprojects, shared resource pools, automatic leveling, decision scenario analysis and earned value tracking. Hands-on training designed for Quebec contractors managing several projects at once.
Training hours are reported to the RBQ and count toward your continuing education requirements.
Contact us for pricing and to schedule a session tailored to your team.